
Geochemistry graphs are valuable tools for the visualization and interpretation of geochemical data. Each type of graph serves a specific purpose and is suited for different scenarios. Let’s explore the Piper, Schoeller, Durov, Ternary, and time series graphs, including what they are, when to use them, and how they compare.
Types of visualization diagrams for geochemistry
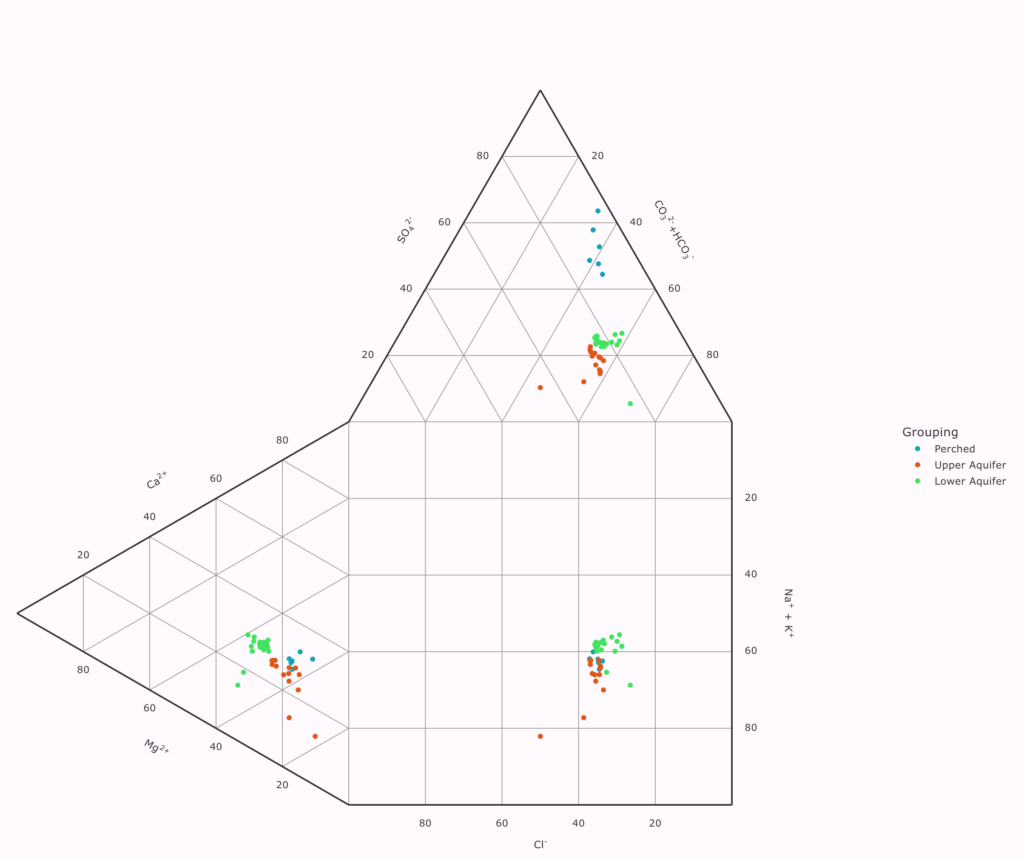
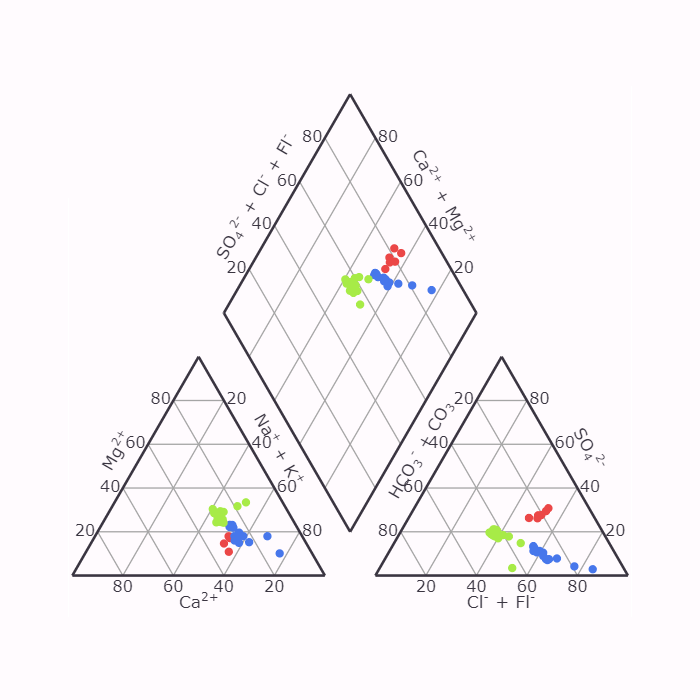
1. Piper Diagram:
- What it is: A Piper diagram is a graphical representation of water chemistry, specifically for hydrogeochemical analysis. It divides the water composition into three major ions: Ca2+, Mg2+, and HCO3- (bicarbonate), represented on a ternary diagram. It also includes a diamond plot for Na+, K+, and Cl- (sodium, potassium, and chloride).
- When to use it: Piper diagrams help compare and classify water samples from different sources, identify dominant ions, and understand the geochemical processes affecting water chemistry. They help delineate water types, such as freshwater, brackish water, or saline water, and identify potential contamination sources.
2. Schoeller Diagram:
- What it is: The Schoeller diagram is another tool used in hydrogeochemical analysis. It represents the dominant ion concentrations in groundwater, focusing on major ions like Cl-, HCO3-, SO4²-, and NO3-. The Schoeller diagram is similar to the Piper diagram but emphasizes anions (negatively charged ions) more.
- When to use it: Schoeller diagrams are handy for assessing groundwater quality, especially in regions where anions play a crucial role in water chemistry. They help identify the sources of anionic contaminants and assess the impact of anthropogenic activities on groundwater.
3. Durov Diagram:
- What it is: The Durov diagram is a graphical representation of soil and sediment composition. It classifies soil samples based on the relative abundance of major elements such as SiO2, Al2O3, Fe2O3, CaO, MgO, Na2O, and K2O. It’s often used in geological and geochemical studies to visualize the mineralogical composition of soils and sediments.
- When to use it: Durov diagrams are employed when analyzing soil or sediment samples to understand mineralogical composition, assess weathering processes, and identify potential sources of soil contaminants or geochemical anomalies.
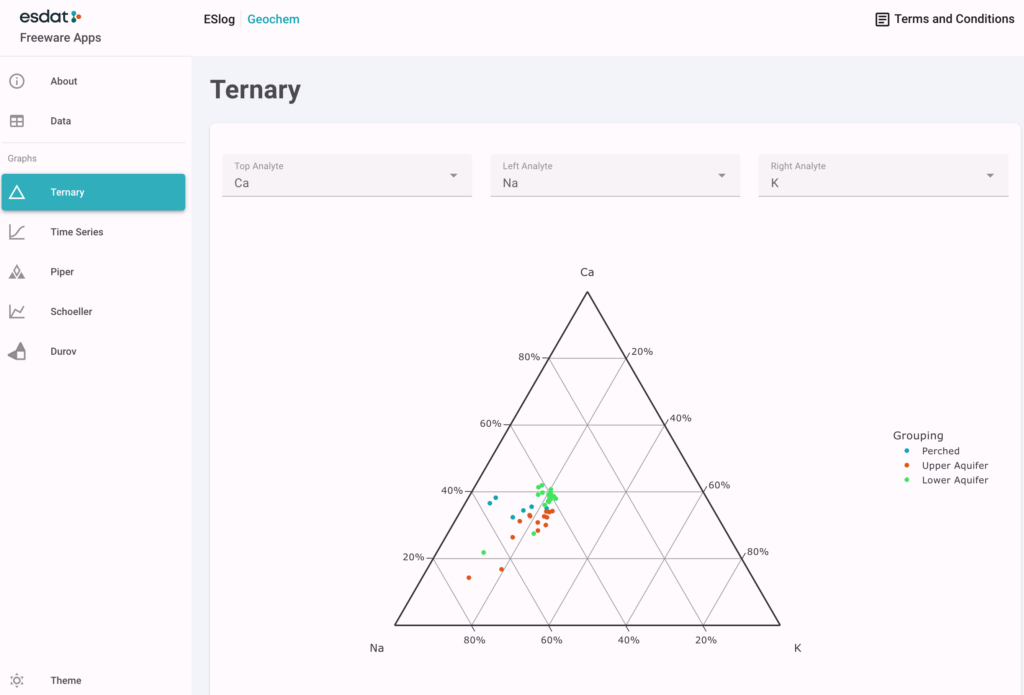
4. Ternary Diagram:
- What it is: A ternary diagram is a graphical representation of three components or variables. Geochemistry often uses it to visualize the proportions of three major rock-forming minerals or chemical components, typically shown in triangular format.
- When to use it: Ternary diagrams are versatile and can be used in various geochemical contexts. They help display the mineral composition of rocks, assess the geochemical evolution of minerals, and visualize the relationship between three variables (e.g., three major elements in a sample).
5. Time Series Graph:
- What it is: A time series graph displays data points collected at successive points in time. It’s commonly used to track changes in a variable over time, making it a valuable tool for visualizing temporal trends in geochemical data.
- When to use it: Time series graphs are crucial for monitoring and understanding changes in geochemical parameters over time. They are employed in environmental studies to track trends in groundwater quality, soil contamination, or any geochemical variable that varies with time.
The comparison of visualization plotting programs in geochemistry
- Purpose: Piper and Schoeller diagrams focus on water chemistry, Durov on soil and sediment composition, and ternary diagrams on the proportions of three variables, while time series graphs are used to visualize temporal trends.
- Variables Represented: Piper and Schoeller diagrams display major ions in water, Durov shows major elements in soil, ternary diagrams represent the proportions of three components, and time series graphs show changes in a variable over time.
- Applications: The choice of graph depends on the type of geochemical data you are analyzing and the specific questions you aim to answer. Use Piper and Schoeller diagrams for water quality assessment, Durov for soil composition analysis, ternary diagrams for displaying mineral proportions, and time series graphs for tracking temporal changes in geochemical parameters.
Understanding these geochemistry graphs’ differences and appropriate uses is essential for effectively visualizing and interpreting geochemical data in various environmental and geological contexts. The choice of graph depends on the specific research objectives and the type of data being analyzed.
The visualization of geochemical data using Free GeoChem software: a comprehensive solution for Piper, Schoeller, and Durov formats.
ESdat Geochemistry Graphs provide a comprehensive solution for the visualization and interpretation of geochemical data in milliequivalents per litre. These diagrams encompass widely used formats, including Piper, Schoeller, Durov, and more.
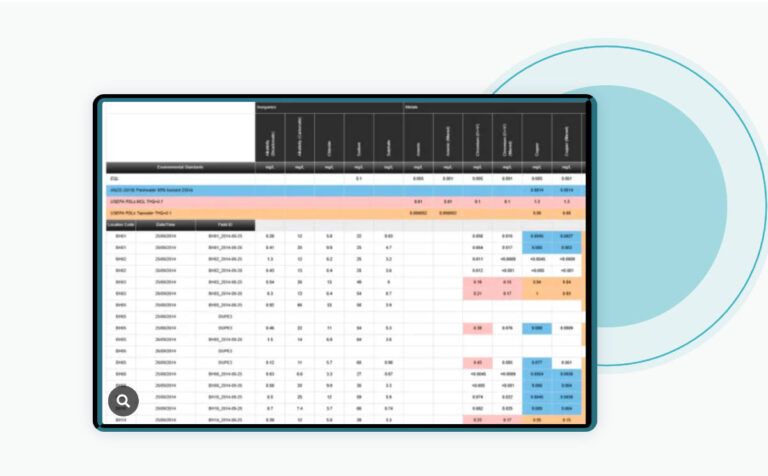
Lab results automatically received into ESdat can be easily filtered and viewed on these graphs. Data can also be uploaded manually from Excel.
The ESdat Freeware Apps are available for everyone to use. However, subscribed ESdat users have the added benefit of centrally managing and analyzing their data, resulting in better data quality and time-saving advantages.
ESdat GeoChem software was released as part of ESdat environmental data management software Version 4.5 released in May 2023 and included:
- Geochem Graphs (including Piper, Durov and Schoeller) are supported
- GWSDAT Export (which provides Mann-Kendall Trend Analysis)
- Logger Data imports can reduce the data frequency.
- Export EDIFs for just a Monitoring Zone, Site or Project
- Ability to manage users’ permissions by user groups
- Graphs can be exported to individual PNG files if needed
- Bulk Co-Scheduling of planned Monitoring Rounds in LSPECS
- Lab Reports can be assigned to Monitoring Rounds on the Lab Report Details screen.
- Notification Settings can be specified per individual user.
ESdat is intuitive and user-friendly software that helps scientists and engineers manage environmental and earth-science data from laboratories, field programs, data loggers, sensors, historical sources, and regulatory standards. All in one place.
Related articles in the visualization and interpretation of geochemical data
Introducing ESdat GeoChem: Revolutionizing Geochemical Data Visualization and Analysis
What examples of geological data can be plotted on a ternary diagram / ternary plot?
Continuous Improvement in Environmental Data Management
What is a Ternary Diagram or Ternary Plot in Geochemistry?


[…] Visualization and interpretation of geochemical data using Piper, Schoeller, Durov, Ternary, Time Se… […]