
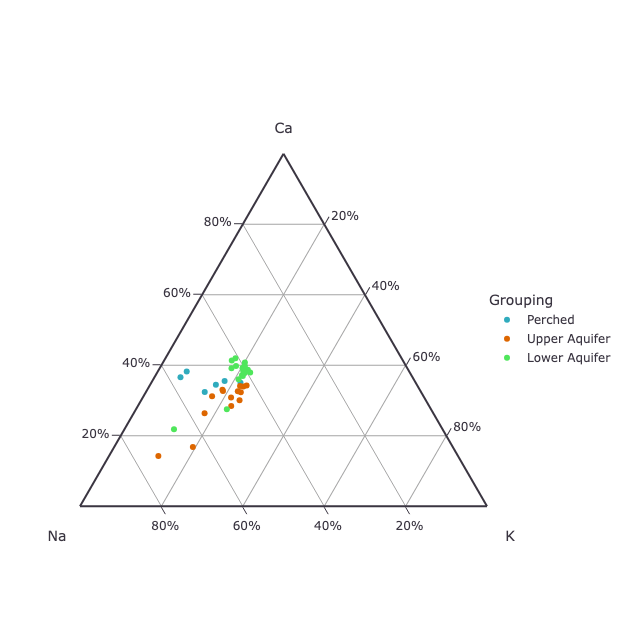
A Ternary diagram or Ternary plot is a powerful tool for visualizing geological data. Some examples of geological data that can be plotted on a ternary diagram include:
- The composition of rocks and minerals in terms of their mineral content.
- The proportion of end-members in a mineral.
- The chemical composition of rocks and minerals.
- The distribution of minerals in a rock.
- The composition of a fluid in terms of its major components.
- The composition of soil in terms of its major components.
- The proportions of different mineral groups.
Overall, ternary diagrams can plot various geological data, making them a valuable tool for geologists.
Ternary diagrams are triangular graphs used to represent compositions of mixtures with three components. In geology, they illustrate rock and mineral composition, aiding in classification schemes. Ternary plots are also common in metallurgy, chemistry, and other sciences. Ternary diagrams are sometimes referred to as a ternary triangle or triangle plot.
Data Management Software for Ternary Plots
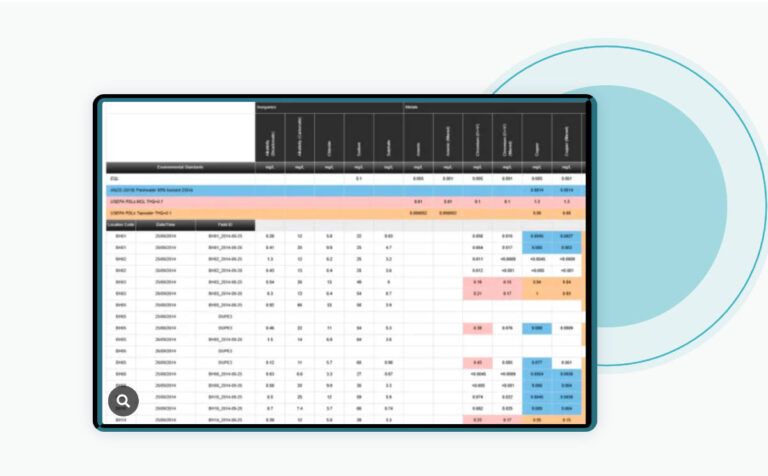
ESdat Geochemistry Graphs provide a comprehensive solution for visualizing geochemical data in milliequivalents per litre. These diagrams encompass widely used formats, including Piper, Schoeller, Durov, and more, for more information on ESdat Geochem visit.
Can a ternary plot or diagram be used to compare the compositions of different minerals?
Yes, ternary diagrams can be used to compare the compositions of different minerals. Many mineral groups can be plotted on a ternary diagram concerning three main components to differentiate between other minerals. Ternary diagrams can show the mineral composition as a percentage of three major components: quartz plus feldspar, calcite plus dolomite, and illite. Ternary diagrams are also used to compare mineral compositions. Overall, ternary diagrams are a powerful tool for visualizing geological data, including the compositions of different minerals.
What are some other applications of ternary plot in geology?
Ternary diagrams are widely used in geology due to their many applications. Some of the other applications of ternary diagrams in geology are:
- To create phase diagrams by outlining the composition regions on the plot where different phases exist.
- To classify rocks and minerals based on their composition.
- To show the distribution of minerals in a rock.
- To compare the compositions of different rock types.
- To show the composition of a mineral in terms of its end-members.
- To show the composition of a fluid in terms of its major components.
- To show the composition of soil in terms of its major components.
- To differentiate between different mineral groups.
- To visualize geological data clearly and concisely.
- To analyze the composition of rocks and minerals in terms of their mineral content, proportion of end-members, or even chemical composition.
How do ternary diagrams help in analyzing soil composition?
Ternary diagrams help analyze soil composition. Here are some ways in which ternary diagrams help in analyzing soil composition:
- Ternary diagrams can translate a sediment’s proportion of the three different grain size classes—sand, silt, and clay—into a soil classification diagram. This allows for the visualization of the soil texture and helps in understanding the soil’s properties.
- Ternary diagrams can represent the different soil texture classes as a function of sand, silt, and clay percentages[4]. This helps in understanding the soil’s composition and how it affects the soil’s properties.
- Ternary diagrams can show soil composition in terms of its major components. This helps understand the soil’s nutrient content and how it affects plant growth.
- Ternary diagrams can be used to differentiate between different soil texture classifications. This helps in understanding the differences between different types of soils and how they affect plant growth.
- Ternary diagrams can be used to analyze the soil’s hydraulic properties. This helps understand how water moves through the soil and affects plant growth.
Overall, ternary diagrams are a powerful tool for analyzing soil composition and understanding the properties of different types of soils.
How are ternary diagrams used in petrography?
Ternary diagrams are widely used in petrography, which studies rocks and their composition. Here are some ways in which ternary diagrams are used in petrography:
- Ternary diagrams are used to classify rocks and minerals based on their composition. This helps in understanding the properties of different types of rocks and minerals.
- Ternary diagrams can show the distribution of minerals in a rock. This helps in understanding the texture and structure of the rock.
- Ternary diagrams can be used to compare the compositions of different rock types. This helps in understanding the differences between different types of rocks.
- Ternary diagrams can be used to show the composition of a mineral in terms of its end members. This helps understand the mineral’s properties and how it affects the rock’s composition.
- Ternary diagrams can create phase diagrams by outlining the composition regions on the plot where different phases exist. This helps in understanding the behaviour of different phases in the rock.
Overall, ternary diagrams are a powerful tool for analyzing the composition of rocks and minerals in petrography. They offer many advantages over other diagrams and are widely used in geology.
Related Articles on Ternary Plot Software
What is a Ternary Diagram or Ternary Plot in Geochemistry?
Introducing ESdat GeoChem: Revolutionizing Geochemical Data Visualization and Analysis
Exciting Software Update Unveiled for ESdat Users Worldwide, Elevating Data Management Experience


[…] What examples of geological data can be plotted on a ternary diagram / ternary plot? […]