
Ternary Diagrams in Geochemistry?
A ternary diagram, also known as a ternary plot or triangle plot, is a three-variable graph used to represent the composition of a mixture or system composed of three components. These ternary diagrams are typically displayed as equilateral triangles, with each apex representing one of the three components. The interior of the triangle represents all possible combinations of these components, and data points are plotted within this triangular space.
Components of a Ternary Diagram
- Vertices (Apices): The three corners of the triangle correspond to the pure compositions of each component. For instance, in geochemistry, these components might be the major chemical constituents of a rock sample, such as silica (SiO2), alumina (Al2O3), and iron oxide (Fe2O3).
- Ternary Axes: The triangle’s three sides connect the vertices and are known as ternary axes. They represent the relative proportions of each component in the mixture, ranging from 0% (the vertex) to 100% (the opposite side).
- Grid Lines and Labels: Grid lines are drawn parallel to the sides of the triangle, helping to quantify the proportion of each component at any point within the diagram. Labels are used to identify specific proportions along the axes.
Uses of Ternary Diagrams in Geochemistry
Ternary diagrams are widely used in geochemistry for various purposes:
- Mineral and Rock Classification: Geochemists use ternary diagrams to classify minerals and rocks based on their chemical compositions. For example, the Streckeisen classification for igneous rocks employs a ternary diagram with silica, alkali, and iron oxide components to categorize rocks into granites, basalts, and andesites.
- Phase Diagrams: Ternary diagrams are essential for constructing phase diagrams, which depict the stability of different mineral phases or assemblages under specific temperature and pressure conditions. These diagrams help researchers predict the mineralogical changes in response to geological processes.
- Geochemical Data Visualization: Ternary diagrams provide an efficient way to visualize and interpret complex geochemical data, making identifying trends and anomalies in geological samples easier. Researchers can locate sources of contamination, trace element associations, and geochemical signatures.
- Geochemical Modeling: Geochemists use ternary diagrams to model and predict the behaviour of chemical species in natural systems, such as groundwater chemistry, mineral dissolution, and chemical weathering.
Free Software for Ternary Diagrams
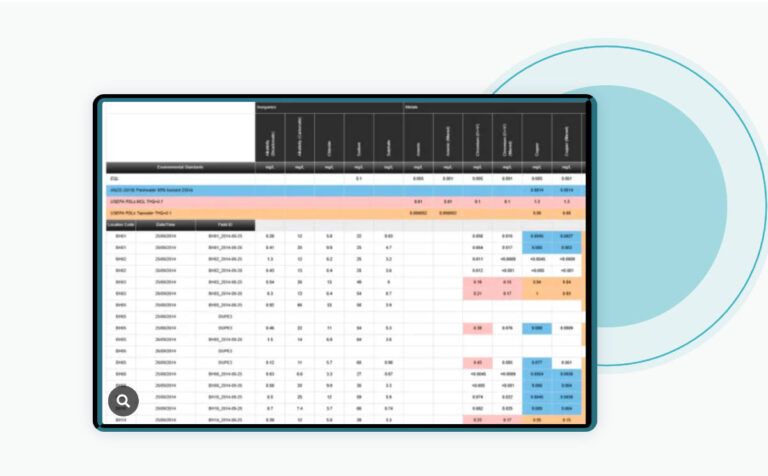
ESdat Geochemistry Graphs provide a comprehensive solution for visualizing geochemical data in milliequivalents per litre. These diagrams encompass widely used formats, including Ternary, Piper, Schoeller, Durov, and more; for more information on ESdat Geochem visit.
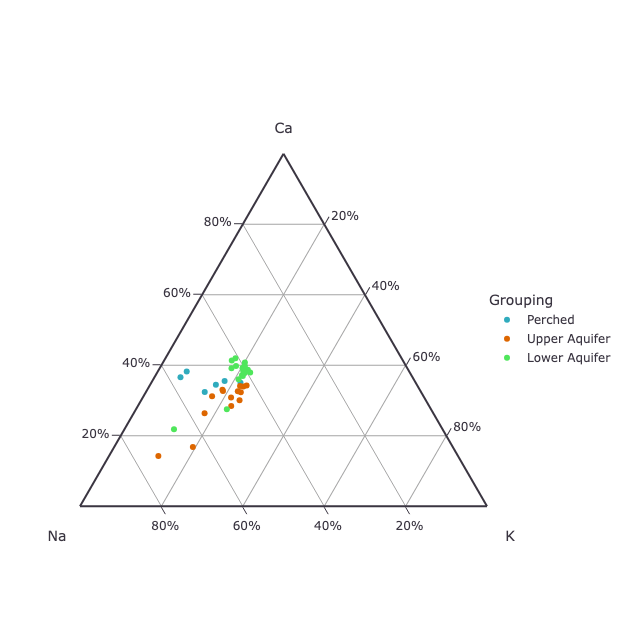
Anatomy of a Geochemical Ternary Plot
Ternary diagrams or plots are graphical representations of mixtures of any three components, typically expressed as percentages whose sum must be 100%. Each apex represents a specific component. For example, let’s say you have a rock composed of a mixture of A, B, and C minerals. Each apex corresponds to 100% of the component written on the vertex. The percentage of this component is 0% on the side opposite to the apex. For instance, if A is on the top left, the bottom right corner represents 0% A. The percentage of the other two components is distributed between the other two corners of the triangle.
Uses of Ternary Diagrams
A Ternary diagram represents the composition of a mixture of three components. They are handy in geochemistry to describe the composition of rocks and minerals. Ternary diagrams can be used to:
- Classify rocks and minerals based on their composition.
- Show the distribution of minerals in a rock.
- Show the composition of a mineral in terms of its end-members.
- Show the composition of a fluid in terms of its significant components.
- Show the composition of soil in terms of its significant components.
Other Diagrams
Other diagrams that can be used to represent the composition of a mixture of components include:
- Binary diagrams: Binary diagrams are graphical representations of mixtures of any two components. They are used to represent the composition of a combination of two components. Binary diagrams are handy in geochemistry to describe the composition of rocks and minerals.
- Spider diagrams: Spider diagrams represent the composition of a sample in terms of its major and trace elements. Spider diagrams are handy in geochemistry to characterize the composition of rocks and minerals.
Conclusion
Ternary diagrams are graphical representations of mixtures of any three components, typically expressed as percentages whose sum must be 100%. They are beneficial in geochemistry to represent the composition of rocks and minerals. Ternary diagrams can be used to classify rocks and minerals based on their composition, show the distribution of minerals in a rock, show the composition of a mineral in terms of its end-members, show the composition of a fluid in terms of its major components, and show the composition of a soil in terms of its significant components. Other diagrams representing the composition of a mixture of components include binary and spider diagrams.
Ternary diagrams can also be used to plot the compositions of different rock types or to compare.
A Ternary diagram can also be used to plot or compare the compositions of different rock types. This is particularly useful in geology to classify rocks and minerals based on their composition. Many rock classification schemes are based on ternary plots. Ternary diagrams can also show the minerals’ distribution in a rock. In addition, ternary diagrams can be used to show the composition of a mineral in terms of its end members. Beyond geology, ternary diagrams are commonly used in metallurgy, chemistry, and other sciences.
What are the advantages of using a ternary diagram in geology?
Ternary diagrams are widely used in geology due to their many advantages. Some of the benefits of using ternary diagrams in geology are:
- Ternary diagrams allow for the visualization of the composition of rocks and minerals clearly and concisely.
- They help classify rocks and minerals based on their composition.
- Ternary diagrams can show the distribution of minerals in a rock.
- They can be used to show the composition of a mineral in terms of its end members.
- Ternary diagrams can be used to compare the compositions of different rock types.
- They allow for the representation of three variables in a two-dimensional graph.
- Ternary diagrams are easy to read and interpret, making them a valuable tool for geologists[.
- They can be used to differentiate between different mineral groups.
Overall, ternary diagrams are a powerful tool for geologists to visualize and analyze the composition of rocks and minerals. They offer many advantages over other diagrams and are widely used in geology.
Related Articles on Ternary Diagrams and Data Visualization
Introducing ESdat GeoChem: Revolutionizing Geochemical Data Visualization and Analysis
Differences in Durov Diagrams and Stiff Diagrams
Exciting Software Update Unveiled for ESdat Users Worldwide, Elevating Data Management Experience


[…] What is a Ternary Diagram or Ternary Plot in Geochemistry? […]
[…] What is a Ternary Diagram or Ternary Plot in Geochemistry? […]