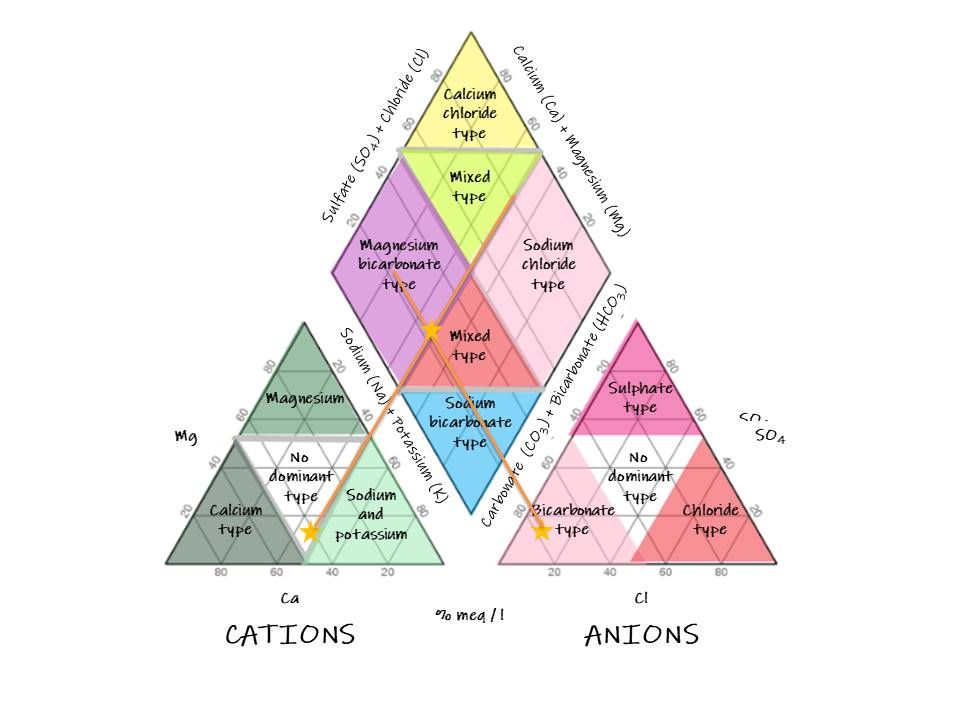
Arthur M. Piper introduced Piper diagrams in 1994. It is used for studying water chemistry and quality. The Piper diagram helps to segregate analytical data necessary for determining the sources of the constituents dissolved in water. The procedure’s applicability is possible due to natural water having anions and cations in chemical equilibrium. The most abundant cations in water are Calcium (Ca), Magnesium (Mg) and Sodium (Na), while the anions are bicarbonate (HCO3), sulphate (SO4) and chloride (Cl). According to Piper (1994), the diagram is made by drawing two triangles which correlate to cations and anions. It also includes a diamond used in summarizing the two triangles, as shown below.
Hydrogeologists and groundwater analysts use Piper diagrams to assess the composition of cations and anions and determine the water sources. The tool is useful in developing an understanding of the chemistry of water through analysis. Hydrochemistry is a field that benefits from using the Piper diagram as it provides insights into hydrochemical processes. Cation and anion exchanges, dissolution of minerals, and silicate weathering influence these processes.
Additionally, through water quality analysis, water use is determined depending on its quality. For instance, water can be used for agricultural activities, drinking and industrial purposes. It is worth noting that cation and anion concentration in water defines its properties and, thus, how it can be used. For instance, residual sodium carbonate defines the suitability of water for irrigation purposes. Generally, the Piper diagram is used for water analysis to understand water sources and properties and therefore define water use purposes.
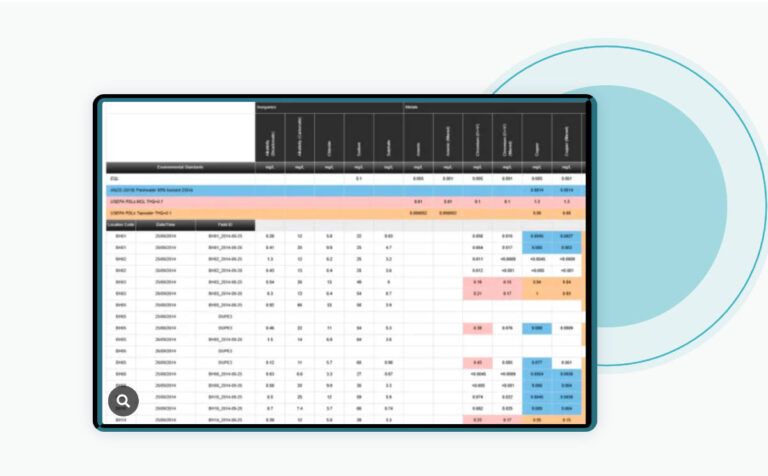
Piper diagrams can be produced using environmental data management software. ESdat, for example, uses a modification of an Excel-based Piper diagram developed by the United States Geological Survey (USGS). For more information https://esdat.net/esdat-features/
References
Kumar, P.S.J. (2013). Interpretation of groundwater chemistry using Piper and Chadha´s diagrams: A comparative study from Perambalur Taluk. Elixir Geoscience, 54, 12208-12211.
Montoya, S. (2018). What is a Piper diagram for water chemistry analysis, and how to create one? Retrieved from https://www.hatarilabs.com/ih-en/what-is-a-piper-diagram-and-how-to-create-one
Related Articles to Piper Diagrams
The 5 Reasons Excel is NOT Reliable Data Management Software