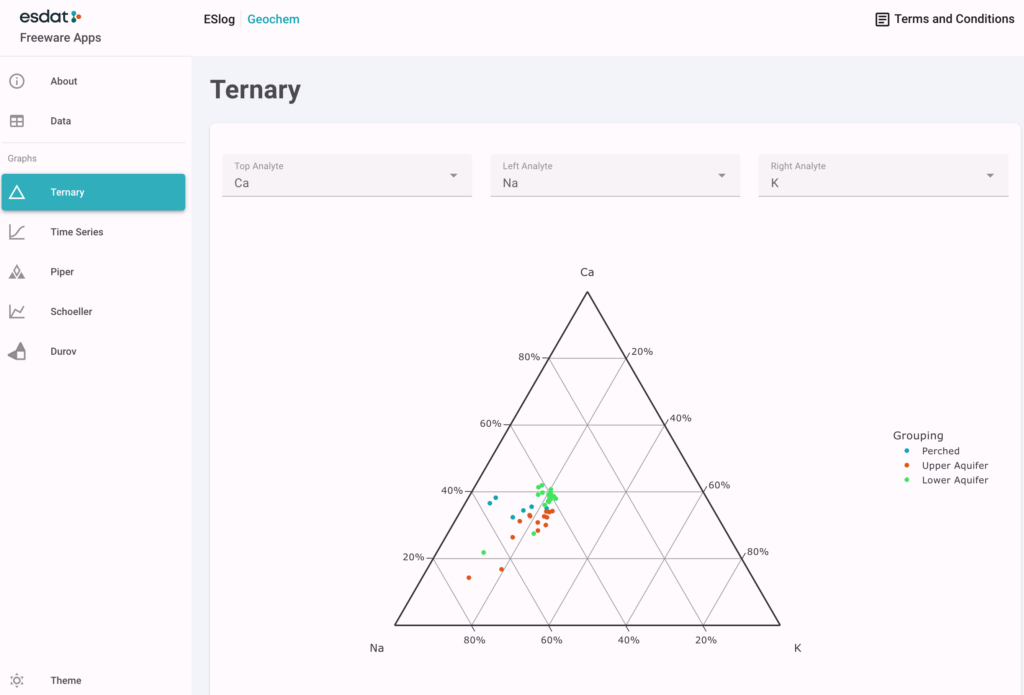
ESdat Geochemistry Graphs provide a comprehensive solution for visualizing geochemical data in milliequivalents per litre. These diagrams encompass widely used formats, including Piper, Schoeller and Durov diagrams. Try ESdat Geochemistry Graphs
Free Geochemistry Graphs provide a comprehensive solution for visualizing geochemical data
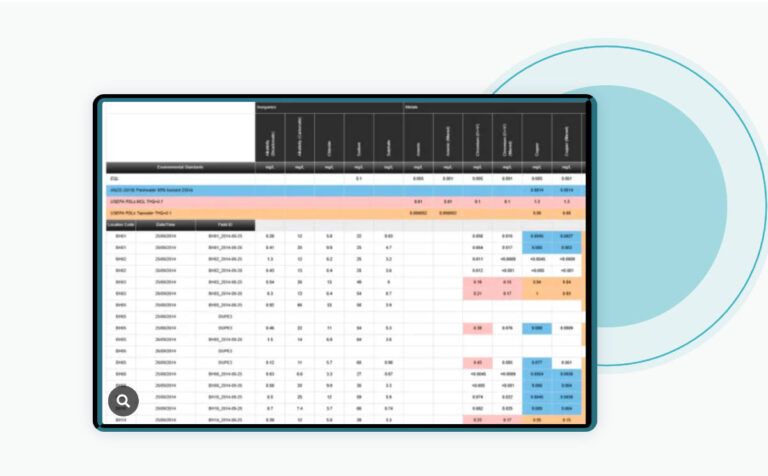
Lab results automatically received into ESdat can be easily filtered and viewed on these graphs. Data can also be uploaded manually from Excel. Try ESdat Geochemistry Graphs
ESdat Data Management Software
ESdat is an intuitive and user-friendly software that helps scientists and engineers manage environmental and earth-science data from laboratories, field programs, data loggers, sensors, historical sources, and regulatory standards. All in one place. https://esdat.net/
ESdat: Designed for Scientists and Engineers.
ESdat is trusted by scientists, engineers, and managers who must understand groundwater, surface water, soil, air, geo-environmental and related data.
Laboratory Integrations
Laboratories worldwide are assessed and approved to upload their reports to ESdat, where the data is validated, loaded and ready for analysis and reporting.
Field Programs
With robust field program management, you can easily plan, execute, and report all large or recurring field program stages.
Logger Data
Review your logger data in real time and visualize trends. Receive alerts and flag problematic data if needed.
Bore Logging
Borehole, geology, and groundwater data can be managed for the automated generation of bore logs.
Analyses and Reports
With ESdat, you can more efficiently analyze, report, and share data while ensuring the highest level of quality control.
Related Articles to Geochemistry Graphs
What is a Ternary Diagram or Ternary Plot in Geochemistry?
What examples of geological data can be plotted on a ternary diagram / ternary plot?
Introducing ESdat GeoChem: Revolutionizing Geochemical Data Visualization and Analysis
Differences in Durov Diagrams and Stiff Diagrams
Exciting Software Update Unveiled for ESdat Users Worldwide, Elevating Data Management Experience