A data trend denotes a correlation that exists between concentration and time or spatial location. It can also refer to a variation in the characteristics of a population with another variable in a predictable fashion. Data trends can either take an increasing, decreasing or cyclic format—this article addresses how to test for data trends with particular emphasis on Linear Regression and Mann-Kendall Trend Analysis.
Linear Regression Data Trend Test (Parametric Methods to Test and Model Trends)
Linear Regression is a parametric (the data that meet the assumption of normality) test that predicts the value of a variable based on the value of another variable (Chan, 2004). The variable that is predicted is called the dependent variable. The variable used to predict the other variable’s value is called the independent or predictor variable.
The type of data trend tested by linear regression is known as linear temporal trends. Ordinary least squares regression allows for the best line of fit to be fixed. When testing the data trend, the linear regression uses a linear correlation coefficient Pearson’s r. Pearson’s r demonstrates the relationship between the observed and calculated concentrations. It also illustrates the direction and strength of the linear trend. When Pearson’s r value is negative, it exemplifies an increasing linear trend. However, when it is negative, it characterizes a decreasing linear trend. Additionally, the absolute value of r ranges from – 1 to 1. Therefore, a trend is considered very strong (positively or negatively) if the absolute value of r is near one.
The weaknesses of this test are:
(1) to use it, the normality conventions cannot be desecrated,
(2) it is extremely sensitive to outliers,
(3) it is very difficult for the none detects to be readily resolved.
Mann-Kendall Trend Test (Nonparametric Method to Test and Model Trends)
Mann-Kendall Trend Analysis (sometimes called the M-K test) is a nonparametric (data that doesn’t meet the assumption of normality) test that measures the strength and direction of correlation between two variables measured on an ordinal scale. In terms of data trends, the Mann-Kendall test assesses monotonic trends. Monotonic trends are trends whereby concentrations are either steadily increasing or decreasing over time. Mann-Kendall Test is not applicable in cases where there are cyclic trends, i.e. where there is an alternating increase followed by a decrease of concentrations. A Mann-Kendall test is commonly employed to detect trends in a series of climate data, environmental data or hydrological data.
In the nonparametric test, Mann-Kendall Test is highly recommended since it can clearly demonstrate whether a trend exists and whether the trend is positive or negative. Moreover, the value from the Kendall Tau calculation allows for a comparison of the strength of the correlation between two data series.
The strengths of the Mann-Kendall test are that:
(1) it can be used in data consisting of non-detects
(2) the findings are not adversely affected by the magnitude of extreme values. However, it cannot be used for data sets comprising mixed detection limits.
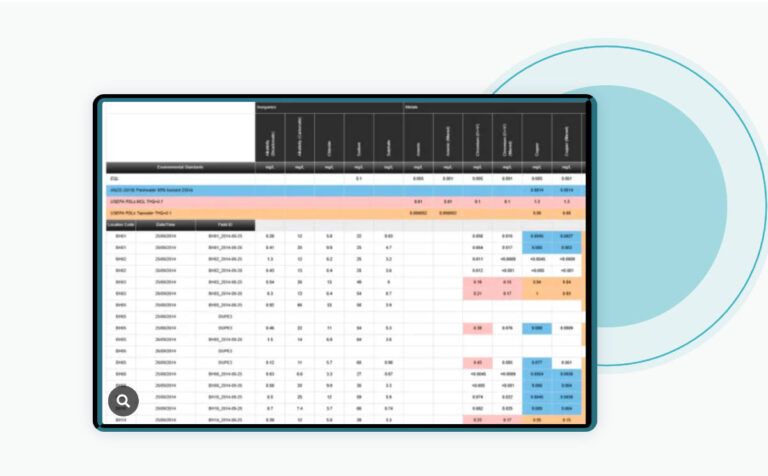
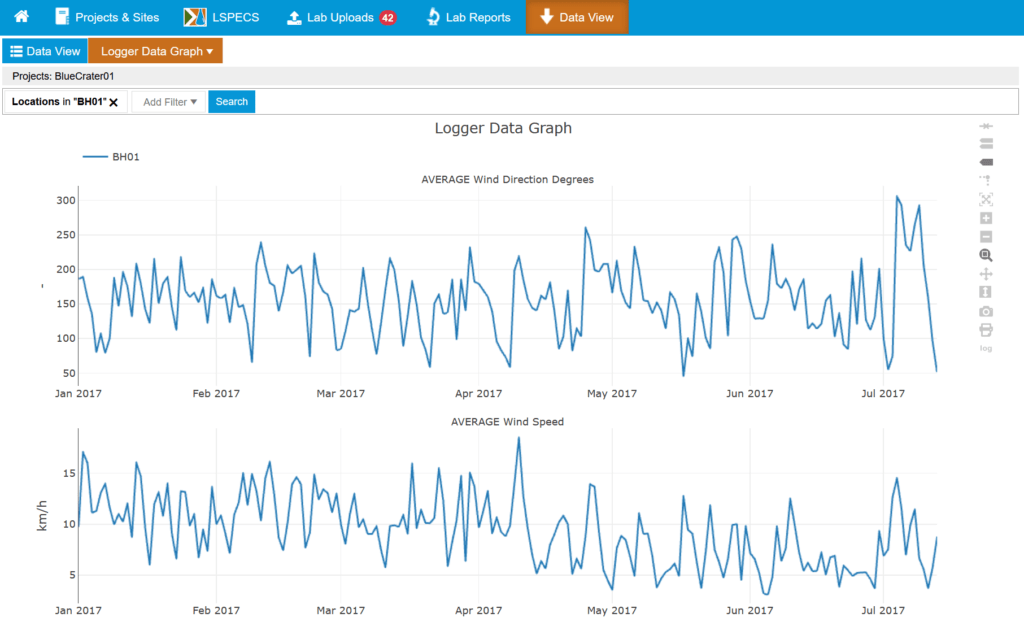
ESdat, Environmental Data management Software, Mann Kendall and Linear Regression trend graphs
ESdat, Environmental Data management Software, Mann Kendall and Linear Regression trend graphs can be produced for any time-series data. Features of graphs include:
- Trends. Mann Kendal or Linear Regression and Annotated on the graph (TUp, TDn, and LH stand for Trending Up/Down, Last value Highest).
- Environmental guidelines/trigger levels
- Produced in Excel (can be edited like any other Excel chart).
For more information on trend analysis using ESdat data management software, please visit https://www.esdat.net/TrendAnalysis.aspx
Graphing and Trend Analysis Tutorial using Data Management Software
Related Data Trend Articles
What is a data logger | how is it used for data logging?
What is an environmental data management specialist?
Using Environmental Data Management in Groundwater Contamination
Environmental data management software for mining: reducing environmental impact
What are Mann-Kendall Trend Tests
Linear Regression in Environmental Data Analysis
What are a linear regression model and simple linear regression?
The state of the environment report
References
Chan, Y. H. (2004). Biostatistics 201: linear regression analysis. Age (years), 80, 55-61. Retrieved from www.smj.org.sg/sites/default/files/4502/4502bs1.pdf
Yue, S., Pilon, P., & Cavadias, G. (2002). Power of the Mann–Kendall and Spearman’s rho tests for detecting monotonic trends in hydrological series. Journal of Hydrology, 259(1-4), 254-271. Retrieved from www.sciencedirect.com/science/article/pii/S0022169401005947