
The link between a dependent variable and one or more independent variables can be modelled statistically using linear regression. It is one of the most popular and straightforward types of regression analysis, making it a preferred option for researchers and analysts across a variety of disciplines.
Finding the best-fit line that encapsulates the relationship between two variables is the essence of linear regression. The line is determined by finding the values of the coefficients that minimize the sum of the squared differences between the observed values and the values predicted by the line.
To analyse the relationships between variables, forecast future outcomes based on historical data, and test cause-and-effect relationship theories, linear regression is utilised in a variety of applications. It is frequently employed in the natural and social sciences, as well as in professions including engineering, psychology, finance, and economics.
Uses of linear regression
Market research is one common application of linear regression. Based on demographic data, advertising expenditures, and previous sales data, it can be used to forecast customer behaviour or sales. In this situation, a product’s sales might be the dependent variable, and the target market’s demographic data or the amount of money being spent on advertising in a specific location might be the independent variables.
Engineering use regression to simulate how input and output variables interact in a system. It can be used to simulate relationships such as those between stress and strain in a mechanical system or between temperature and pressure in a thermodynamic system. In this situation, the system’s output, such as pressure or strain, may be the dependent variable, and the inputs, such as temperature or stress, maybe the independent variables.
To understand the relationships between factors like income, education, and employment, linear regression is applied in the social sciences. Employment may be the dependent variable in this situation, while income and education could be the independent factors. Researchers can find out factors that affect employment, such as the relationship between income and education, by examining the relationship between these variables.
Natural scientists employ linear regression to simulate relationships between elements like air pressure, temperature, and wind speed. The independent variables may be temperature and air pressure, while the dependent variable could be wind speed. Scientists can learn more about variables that affect wind speed, such as the relationship between temperature and atmospheric pressure, by examining the relationship between these variables.
Problems with linear regression analysis
The fact that L- regression is a straightforward, understandable approach that can be used to solve a variety of issues is a crucial benefit. It is also a realistic option for big data sets due to its processing efficiency. However, when selecting a statistical method, one should take into account the limits of linear regression. Its assumption of a linear relationship between the dependent and independent variables is one of its most significant weaknesses. Linear regression might not produce a reliable model if the relationships between the variables are not linear. Other regression techniques, including polynomial or logistic regression, may be more applicable in this situation.
The assumption that the relationship between the variables is deterministic, or that the same input will always result in the same output, is another restriction of L-regression. L-regression might not produce a reliable model if the data are subject to random error or fluctuation. Other approaches, like time series analysis or Bayesian regression, may be better suitable to this situation.
Last but not least, L-regression makes the assumption that the independent variables are not highly linked and do not exhibit multicollinearity. The findings of linear regression may be inconsistent or unreliable if there is multicollinearity. Other techniques, including principal component analysis (PCA) or ridge regression, may be better suitable to this situation. By grouping strongly correlated variables into fewer principle components, PCA can reduce the number of variables. In contrast, by including a penalty component in the regression equation, ridge regression can be utilised to address the problem of multicollinearity.
The assumptions made by linear regression also include the normal distribution and constant variance of the errors. Linear regression may not produce reliable findings if the errors are not normally distributed or have non-constant variance. Other techniques, like weighted least squares or robust regression, may be more applicable in this situation.
To guarantee accurate findings, it is essential to select the right approach based on the characteristics of the data and the relationship between the variables. For modelling the relationship between dependent and independent variables, linear regression is a potent and popular technique. Although it has some drawbacks, it is a straightforward and effective approach that may be used to solve a variety of issues.
How do you test for data trends with environmental data management software?
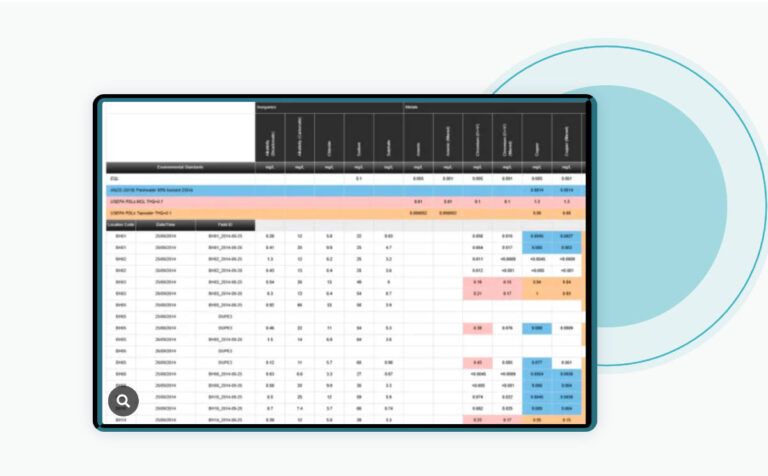
A data trend denotes a correlation that exists between concentration and time or spatial location. It can also refer to a variation in the characteristics of a population with another variable in a predictable fashion. Data trends can either take an increasing, decreasing or cyclic format—this article addresses how to test for data trends with particular emphasis on Linear Regression and Mann-Kendall Trend Analysis.

Tutorial 2- ESdat Introductory Skills
Tutorial 3-1 Analysing Chemistry
TUTORIAL – Importing & Analysing Water Levels
What is a linear regression model?
A linear regression model is a statistical model that is used to analyze the linear relationship between a dependent variable and one or more independent variables. The model assumes that there is a linear relationship between the variables, and it calculates the slope and intercept of the linear equation that best fits the data. The model can be used for prediction, hypothesis testing, and understanding the relationship between the variables.
What are the types of linear regression?
There are two main types of linear regression: simple linear regression and multiple linear regression.
- Simple linear regression: Simple linear regression is used when there is only one independent variable (X) and one dependent variable (Y). The goal is to find a linear relationship between the two variables and estimate the slope and intercept of the line that best fits the data.
- Multiple linear regression: Multiple linear regression is used when there are two or more independent variables (X1, X2, etc.) and one dependent variable (Y). The goal is to find a linear relationship between the dependent variable and the independent variables and estimate the regression coefficients (slopes) and intercept of the plane or hyperplane that best fits the data.
Other types of L-regression include weighted linear regression, robust linear regression, and polynomial regression, which involve modifying the standard L-regression model (LRM) to address specific issues or assumptions.
What is simple linear regression?
A simple regression technique looks at the linear connection between two continuous variables, commonly referred to as the dependent variable (Y – one dependent variable) and the independent variable (X – one independent variable). It assumes that the two variables are related linearly and calculates the slope and intercept of the linear equation that best matches the data. Because there is just one independent variable in the model, it is considered “simple.” Simple L-regression can be used to make predictions, test hypotheses, and show how the two variables are related.
What is a regression coefficient?
A regression coefficient, also known as a slope coefficient, is a value that represents the change in the dependent variable (Y) for a unit change in the independent variable (X), with all other factors held constant. In simple linear regression, there is only one regression coefficient, which represents the slope of the line that best fits the data. In multiple linear regression, there is a regression coefficient for each independent variable, and they represent the change in the dependent variable for a unit change in each independent variable, holding all other variables constant. The regression coefficient is a key output of a regression analysis, and it is used to make predictions and draw conclusions about the relationship between the variables.
What is regression analysis?
Regression analysis is a statistical technique used in linear regression to examine the relationship between one or more independent variables (X) and a dependent variable (Y). It involves fitting a linear equation to the data and estimating the coefficients of the equation. The coefficients are then used to make predictions about the value of the dependent variable based on the values of the independent variables.
Regression analysis can be used for prediction, where the goal is to use the regression equation to predict the value of the dependent variable for a given set of values of the independent variables. It can also be used for hypothesis testing, where the goal is to determine if there is a significant relationship between the independent and dependent variables.
Regression analysis involves several steps, including data cleaning and preparation, choosing the appropriate model, estimating the coefficients, evaluating the model fit, and interpreting the results. It is an important tool in statistics and data analysis and is used in a wide range of fields, including finance, economics, social sciences, and engineering.
What is a linear regression equation?
A L-regression equation is a mathematical equation that represents the linear relationship between the dependent variable (Y) and one or more independent variables (X). The equation takes the form:
Y = b0 + b1X1 + b2X2 + … + bn*Xn
where Y is the dependent variable, X1, X2, …, Xn are the independent variables, b0 is the intercept, and b1, b2, …, bn are the regression coefficients (slopes) that represent the change in Y for a unit change in X, holding all other variables constant.
For simple linear regression with one independent variable, the equation takes the form:
Y = b0 + b1*X
where Y is the dependent variable, X is the independent variable, b0 is the intercept, and b1 is the regression coefficient (slope) that represents the change in Y for a unit change in X.
The LR equation can be used to make predictions about the value of the dependent variable for a given set of values of the independent variables. It can also be used to examine the relationship between the variables and test hypotheses about the significance of the relationship.
Related Data Trends Articles
What is a data logger | how is it used for data logging?
What is an environmental data management specialist?
Environmental data management software for mining: reducing environmental impact
Linear Regression in Environmental Data Analysis
The state of the environment report


[…] What are a linear regression model and simple linear regression? […]