Streamline Environmental Data Management with ESdat’s Trend Analysis Feature
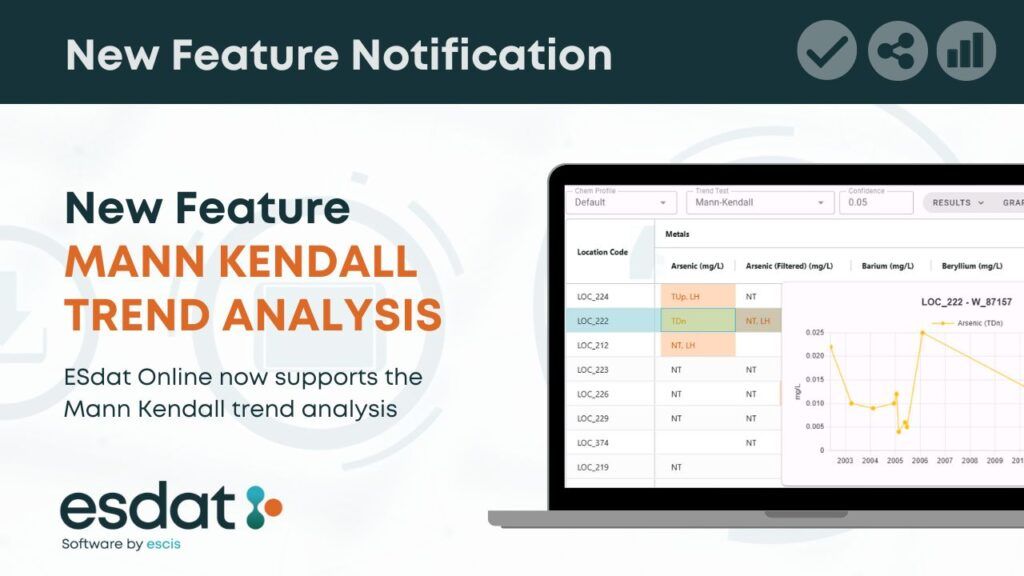
Analyzing trends in complex datasets in environmental consulting is crucial for effective decision-making. Whether it’s monitoring groundwater quality, air pollutants, or contaminant levels at a remediation site, detecting trends helps professionals identify risks, evaluate changes, and ensure regulatory compliance. ESdat Data Management Software simplifies this process by integrating robust statistical tools like Mann-Kendall Trend Analysis and Linear Regression and unique features tailored to environmental data.
What is the Mann-Kendall Trend Analysis?
The Mann-Kendall (MK) trend analysis is a nonparametric statistical test designed to identify trends in time series data. It evaluates whether data shows a statistically significant upward, downward, or no trend over time. Unlike some statistical methods, Mann-Kendall does not require the data to follow a specific distribution, making it particularly useful for environmental datasets that may be nonlinear or incomplete.
Originally described in:
• Mann, H.B. (1945): Nonparametric tests against trend, Econometrica 13:163-171.
• Kendall, M.G. (1975): Rank Correlation Methods, 4th edition, Charles Griffin, London.
In ESdat, the Mann-Kendall analysis is applied using a one-tailed approach, which focuses specifically on detecting a trend in one direction (up or down). This method contrasts with the typical two-tailed Mann-Kendall test and is particularly suited to environmental data analysis.
How ESdat Enhances Trend Analysis
ESdat Data Management Software provides an intuitive platform for conducting Mann-Kendall and Linear Regression analyses. Here’s how ESdat makes trend analysis accessible and impactful:
1. Flexible Analysis Techniques
• Users can select the Mann-Kendall or Linear Regression method, depending on the dataset and desired insights.
• A significance level can be specified, with typical choices being:
• 0.05: Confidence Level of 95%.
• 0.1: Confidence Level of 90%.
2. Location-Specific Trends
• Trends are calculated for each analyte at individual locations and wells.
• A minimum of three data points is required for trend analysis, ensuring robust statistical evaluation.
3. Easy-to-Understand Results
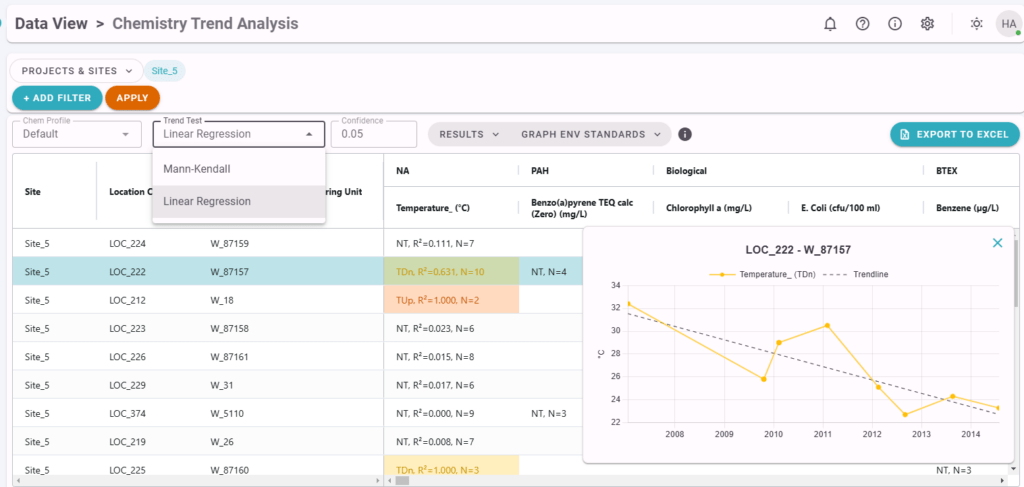
• TUp (Trending Up): Highlighted in orange to indicate upward trends.
• TDn (Trending Down): Highlighted yellow to signify downward trends.
• LH (Last Value Highest): Indicates a spike in the most recent value, highlighted in orange.
• NT (No Trend): Denotes no significant trend.
• Blank Cells: Indicates insufficient data (<3 points) for analysis.
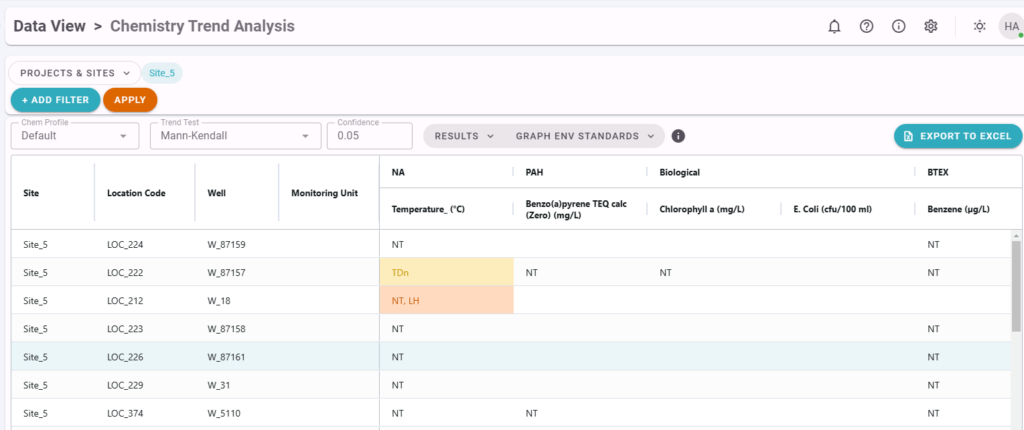
Users can select to show the trend statistics and the trend result, and clicking on a trend result will show a data graph, as shown below.
4. Unique Feature: “Last Value is Highest”
This feature allows users to quickly identify cases where the most recent data point shows a notable increase, an essential tool for early detection of potential issues in environmental monitoring.
Why Environmental Consultants Love ESdat for Trend Analysis
1. Automated Efficiency
ESdat’s built-in tools eliminate the need for manual calculations, reducing errors and saving time.
2. Visual Insights
Trend results are visually displayed using colour-coded shading, making it easy to interpret complex data.
3. Regulatory Compliance
Results can be seamlessly integrated into reports to meet environmental standards, demonstrating compliance and informing stakeholders.
4. Data-Driven Decisions
By identifying upward or downward trends, consultants can proactively address potential issues, ensuring timely intervention.
5. Scalability
Whether working on small-scale projects or monitoring long-term datasets, ESdat’s tools grow with your needs.
Simplify Your Environmental Data Management with ESdat
In addition to its powerful trend analysis capabilities, ESdat is designed to streamline every aspect of environmental data management:
• Laboratory Integration: Automates data imports and ensures accuracy.
• Pre-Compiled Standards: Saves time by providing up-to-date environmental standards.
• Comprehensive Outputs: Generate QA reports, exceedance tables, maps, graphs, and statistical analyses.
• Third-Party Integrations: Works seamlessly with tools like ProUCL, ArcGIS, Surfer, and Power BI.
Conclusion
Integrating Mann-Kendall Trend Analysis within ESdat empowers environmental consultants to extract meaningful insights from their data. By offering robust statistical tools, clear visualizations, and efficient workflows, ESdat ensures that trend analysis is not just a technical task but a strategic advantage.
Want to see how ESdat can transform your data management and analysis? Try it for free at www.esdat.net. Explore the possibilities and unlock the full potential of your environmental datasets.
Related Articles on Mann-Kendall Analysis
FAQs: Mann-Kendall Trend Analysis and ESdat Integration
ESdat Online now supports the eagerly-awaited Mann Kendall trend analysis
Exciting Software Update Unveiled for ESdat Users Worldwide, Elevating Data Management Experience
How do you identify data trends in time series?
What are a linear regression model and simple linear regression?


