
PFAS data management is the process of organizing, checking, and maintaining sampling results and their supporting information so they can be used reliably in environmental investigations. It connects chemical measurements with locations, dates, analytical methods, quality information, and source records.
For groundwater investigations, this work creates the foundation for meaningful comparisons and spatial analysis. A map of concentrations becomes more useful when reviewers can establish which samples belong to each location, whether results are comparable and what uncertainties remain.
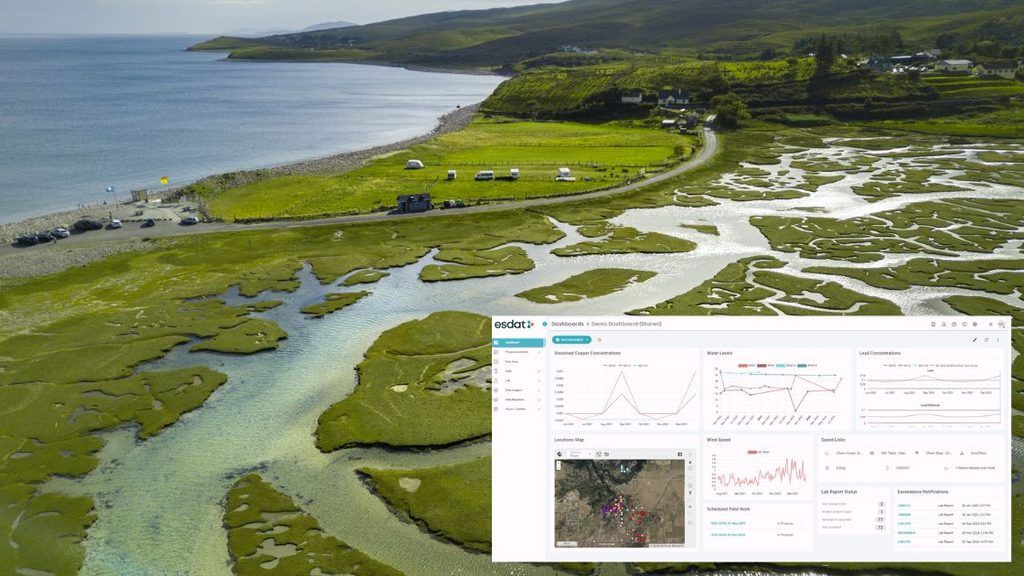
The Government of Jersey’s PFAS investigation offers a documented example of ESdat being used within this process. Its value for other environmental teams lies in the practical questions it raises about historical records, database design and the relationship between data and interpretation.
Key takeaways
- Historical PFAS records need context. Results should remain connected to sample locations, analytical methods, limits and original sources.
- Location matching deserves explicit review. Incorrect links between samples and monitoring points can undermine otherwise accurate maps.
- A shared chemical name does not establish comparability. Check the substance definition, method, units and analytical coverage.
- Database, GIS and conceptual site model roles are complementary. They organise evidence, display spatial relationships and support interpretation.
- Uncertainty should remain visible. Assumptions and unresolved records need documented treatment.
- ESdat is a documented part of the Jersey workflow. The study illustrates its use without establishing that software alone resolved the investigation.
A documented example: Jersey’s PFAS investigation
Arcadis’s June 2023 Phase 1 report for the Government of Jersey examined the St Ouen’s Bay and upper Pont Marquet catchments. Section 3 describes combining government records in ESdat, reconciling location identifiers and digitising additional laboratory certificates.
Quality checks included completeness, outliers, coordinates and comparisons with source records. The report also acknowledged assumptions and unresolved sample-location relationships.
Records were exported to create GIS layers. Updates were manual within the described arrangement; the report does not document automatic synchronisation. [1, sections 3.1–3.3]
An Arcadis technical poster separately lists ESdat database creation, historical government data, QA/QC and GIS development among completed activities. [2]
This article uses Phase 1 as a historical data-management example. Jersey has subsequently published Phase 2 material; the earlier report should not be presented as the investigation’s current endpoint. [3]
Why historical PFAS data require careful preparation
A historical dataset can contain information collected for different questions over many years. Before combining it, establish what each record can support.
A useful starting point is to ask:
- Was the sample groundwater, surface water, soil or another matrix?
- Where and when was it collected?
- Which substances were analysed?
- Which method and reporting conventions applied?
- What quality information accompanies the result?
- Can the original record be retrieved?
PFAS data usability depends on whether the information meets the stated project needs and whether users understand limitations caused by uncertainty or bias. ITRC guidance recommends considering laboratory narratives, field and QC sample results, and relevant sample-specific quality information when assessing usability. [4]
The preparation task should therefore be defined around the intended decision. A dataset suitable for locating possible investigation areas may need further assessment before it can support detailed trend analysis or risk assessment.
A practical PFAS data-management workflow
For a new consolidation project, a useful sequence is:
Source inventory → location reconciliation → analytical standardisation → quality review → controlled dataset → GIS and interpretation → investigation planning
The following steps are practical recommendations for environmental teams. They should be adapted to the project’s objectives, source material and quality requirements.
1. Inventory the records before importing them
Create a source register listing each database export, spreadsheet, laboratory package, report and spatial dataset.
For each source, record its owner, date range, format and known limitations. Identify overlapping deliveries so that the same laboratory results are not inadvertently counted twice.
Retain original files separately from working copies. The source register should make it possible to trace a consolidated record back to the material from which it was created.
2. Reconcile monitoring locations
Build a location register before treating similarly named sampling points as equivalent.
Consider retaining:
| Field | Purpose |
|---|---|
| Project location identifier | Provides a consistent reference within the consolidated dataset. |
| Original identifiers | Preserves links to source systems. |
| Location description | Helps reviewers distinguish nearby monitoring points. |
| Coordinates and coordinate system | Supports spatial checks and conversion. |
| Construction or depth information | Helps interpret groundwater observations where available. |
| Match evidence and review status | Documents why records were linked and whether uncertainty remains. |
Names, addresses and coordinates provide evidence for a match, but they should be considered together.
Where a match cannot be established, keep the record identifiable as unresolved. Assigning an uncertain sample to a convenient nearby point creates apparent precision that the evidence may not justify.
3. Standardise analytical information
Create a controlled reference list for parameters while preserving the laboratory’s original labels.
For each proposed mapping, ask:
- Does the original name identify the same substance?
- Is a chemical identifier available?
- Does the result represent an individual compound or a defined sum?
- Are units and matrix information clear?
- Is the analytical method recorded?
- Are reporting limits and qualifiers retained?
Record transformations, including unit conversions and parameter mappings, so another reviewer can reproduce them.
The objective is a consistent dataset with an explainable history.
4. Review data quality and usability
Separate technical import checks from scientific assessment.
A file can pass structural checks while containing results that require qualification or further review. ITRC’s environmental data-management guidance distinguishes verification, validation and usability assessment, and recognises the importance of reviewing associated metadata. [5]
| Review stage | Example question |
|---|---|
| Structural checks | Are dates, identifiers and numerical fields readable? |
| Verification | Do the records conform to the required delivery and project specifications? |
| Validation | What do the analytical quality findings imply for the results? |
| Usability assessment | Can these data answer the intended project question? |
Define who performs each stage and where decisions are recorded.
An unusual concentration should prompt review rather than automatic deletion. Conversely, a plausible value should not be accepted solely because it looks reasonable.
5. Maintain a controlled analysis dataset
Before producing maps or statistics, define the selection rules.
Specify which review statuses are included, how qualified results are treated and how unresolved locations are handled. Record the dataset version and extraction date.
This makes later questions easier to answer: which information supported a particular map, and what changed when it was updated?
Preserve non-detects and analytical coverage
Two distinctions are especially useful when reviewing historical PFAS information:
“Not analysed” is different from “analysed and not detected.”
A non-detect is different from a measured zero.
ITRC’s data-evaluation guidance discusses measurements below analytical limits and the relevance of qualifiers to interpretation. [6]
For data-management purposes, retain the result’s detection status, applicable limit and qualifier. Document the statistical treatment separately.
Also keep a record of which analytes were requested or reported. Before comparing totals across sampling events, establish that the totals represent compatible groups of substances and calculation rules.
A useful analytical coverage table might show:
| Sampling event | Reported analytes | Method | Relevant limits | Comparison notes |
|---|---|---|---|---|
| Historical event | Recorded from source | Recorded or unavailable | Preserved as reported | Identify limitations before use. |
| Later event | Recorded from source | Recorded from laboratory package | Preserved as reported | Check compatibility with earlier data. |
This helps reviewers distinguish a change in the evidence available from a change in environmental conditions.
Database, GIS and conceptual site model: different roles
These components answer related questions.
| Component | Primary role | Question it helps answer |
|---|---|---|
| Environmental database | Maintains structured observations and supporting information. | What records are available, and what do they represent? |
| GIS | Displays and analyses information in its spatial context. | Where are observations, features and gaps located? |
| Conceptual site model | Organises the interpretation of sources, pathways and receptors. | How might contamination move and affect relevant receptors? |
A conceptual model develops as evidence improves. Groundwater risk-assessment guidance from the Environment Agency describes refining the model throughout assessment as additional information becomes available. [7]
The database should preserve observations and their provenance. GIS outputs should make their selection and presentation rules clear. The conceptual model should identify where interpretation depends on assumptions or missing evidence.
Preparing a reliable handover to GIS
Treat an export as a defined deliverable.
Recommended export information includes:
- Location and sample identifiers.
- Coordinates and their reference system.
- Sampling dates and relevant depths.
- Parameter names, values and units.
- Detection status, limits and qualifiers.
- Review status and source references.
- Dataset version and selection rules.
Then check the exported records against the database and inspect the mapped locations.
For maps showing summary concentrations, state the period, statistic and treatment of non-detects. Keep a clear distinction between sampled points and any interpreted boundary or interpolated surface.
A map should help users see the evidence and its limits.
Using data gaps to guide further investigation
The most useful data-gap register connects each uncertainty to a decision.
For example:
| Question | Information to review | Possible follow-up |
|---|---|---|
| Are observations comparable over time? | Methods, analyte coverage and limits | Define a consistent comparison subset or collect comparable new data. |
| Is a result linked to the correct location? | Original identifiers, coordinates and records | Resolve the location before spatial use. |
| Is the relevant groundwater interval represented? | Well construction and sampling information | Review records or plan targeted investigation. |
| Is the apparent spatial pattern adequately supported? | Sampling coverage and uncertainty | Consider additional monitoring locations. |
These are planning prompts, not automatic instructions to collect more samples. Qualified personnel should determine whether further information would materially improve the assessment.
Where ESdat fits
ESdat’s current laboratory integration documentation describes laboratory data exchange, quality checks, review and approval functions, audit history and QA reporting against configurable objectives. [8]
Those capabilities are relevant to managing ongoing data after historical consolidation. Product documentation and project evidence serve different purposes: one describes available functionality; the other records a particular application.
For ESdat or another environmental database, evaluate the proposed configuration using representative project data.
Questions for software evaluation
- Can original identifiers and source references be retained?
- Can parameter mappings and unit conversions be reviewed?
- Are detection limits, reporting limits and qualifiers preserved?
- Can users distinguish provisional, reviewed and restricted-use records?
- Can amendments be traced?
- Do GIS exports retain the information needed for interpretation?
- Can unresolved records remain visible without entering unsuitable analyses?
- Can the organisation retrieve its data and documentation for future use?
Ask suppliers to demonstrate these tasks with a realistic historical dataset, including ambiguous records and corrections.
Frequently asked questions
What is PFAS data management?
It is the organised handling of PFAS sampling results and supporting information so users can assess their meaning, quality and suitability for environmental decisions.
Why use an environmental database for a PFAS investigation?
A database can maintain consistent relationships between locations, samples, analyses and review information. Its value depends on the quality of the source material and the controls applied during consolidation and ongoing use.
Can historical PFAS results be combined with new monitoring data?
Potentially. First assess compatibility of locations, matrices, substances, methods, units, limits and quality information. Document any restrictions on comparison.
Does GIS replace an environmental database?
GIS and databases have complementary roles. A useful workflow defines where records are maintained, how spatial outputs are produced and how updates are checked.
How was ESdat used in Jersey?
The Phase 1 report documents ESdat database development and exports for GIS, including location reconciliation and quality checks. The case-study section above summarises the documented scope. [1]
Does an unusual PFAS concentration mean the record is wrong?
No. An unusual result warrants investigation. Review the source record, units, sample identity and available quality information before deciding how to use it.
Is a non-detect evidence that PFAS is absent?
It indicates that the substance was not reported as detected under the applicable analytical conditions. Interpretation depends on the method, limits and quality information. [6]
Does consolidating records establish that they are suitable for risk assessment?
No. Data usability must be assessed against the intended purpose, with limitations understood and documented. [4, 5]
Glossary
| Term | Meaning |
|---|---|
| Analyte | A substance targeted or measured by an analytical procedure. |
| CAS Registry Number | A chemical identifier that can assist substance matching; the reported chemical definition still requires review. |
| Conceptual site model (CSM) | An organised interpretation of site conditions and potential contaminant sources, pathways and receptors. |
| Data provenance | Information showing where a record originated and how it was processed. |
| Data reconciliation | Reviewing differences between records or systems to establish consistent, documented relationships. |
| Data usability | The suitability of information for a defined purpose, considering its quality and limitations. |
| Detection limit | A method-related threshold concerning the ability to distinguish an analyte from background. |
| Environmental database | A structured system for maintaining environmental observations and related information. |
| GIS | Geographic information system: software for managing, displaying and analysing spatial information. |
| Non-detect | A result not reported as detected under the applicable analytical conditions. |
| PFAS | Per- and polyfluoroalkyl substances, a broad group of chemicals. |
| QA/QC | Quality assurance and quality control: planned processes and checks used to manage and assess quality. |
| Qualifier | A code communicating a condition or limitation affecting a result. |
| Reporting limit | A threshold applied when reporting analytical results under specified arrangements. |
| Source–pathway–receptor linkage | A potential connection between contamination, a route of movement or exposure, and a receptor. |
Related reading
For the wider organisational context, read How Governments Use Environmental Data Management Systems to Improve Monitoring, Compliance and Public Trust.
References
- Arcadis Consulting (UK) Ltd. June 2023. PFAS Hydrogeological Study, Phase 1 Report: Desk Study, Initial Conceptual Site Model and Scope for Further Assessment. Prepared for the Government of Jersey. Section 3, printed pages 19–22, documents database and GIS development.
- Hurst, J., Arcadis. PFAS Management in Drinking Water Catchments. Technical poster, Government of Jersey case study.
- Government of Jersey. PFAS in Jersey. Official study information and links to Phase 1 and Phase 2 publications.
- Interstate Technology & Regulatory Council. PFAS: Sampling and Analytical Methods. Guidance on sampling, analysis and data usability.
- Interstate Technology & Regulatory Council. Analytical Data Quality Review: Verification, Validation, and Usability. Environmental data-management guidance.
- Interstate Technology & Regulatory Council. Risk Assessment: Data Evaluation. Discussion of analytical data, limits and qualifiers.
- Environment Agency. Groundwater Risk Assessment for Your Environmental Permit. Guidance on hydrogeological conceptual models and their refinement. Referenced for general principles, not as a statement of Jersey’s regulatory requirements.
- ESdat. Laboratory Integration. Vendor documentation describing laboratory exchange, quality checks, review, approval and audit functions.